Online
Forge Hypervisor
Online
Vault Storage
Online
Controller-01
Online
Monitor-01
Monitoring Stack
Prometheus, Grafana, and Node Exporter are used to monitor the homelab environment and provide visibility into system performance and uptime.
Prometheus
Collects CPU, memory, storage, uptime, and network metrics from all systems.
Grafana
Provides dashboards and visualizations for all monitored infrastructure.
Node Exporter
Installed on Forge, Vault, Media, and Controller-01 to provide system metrics.
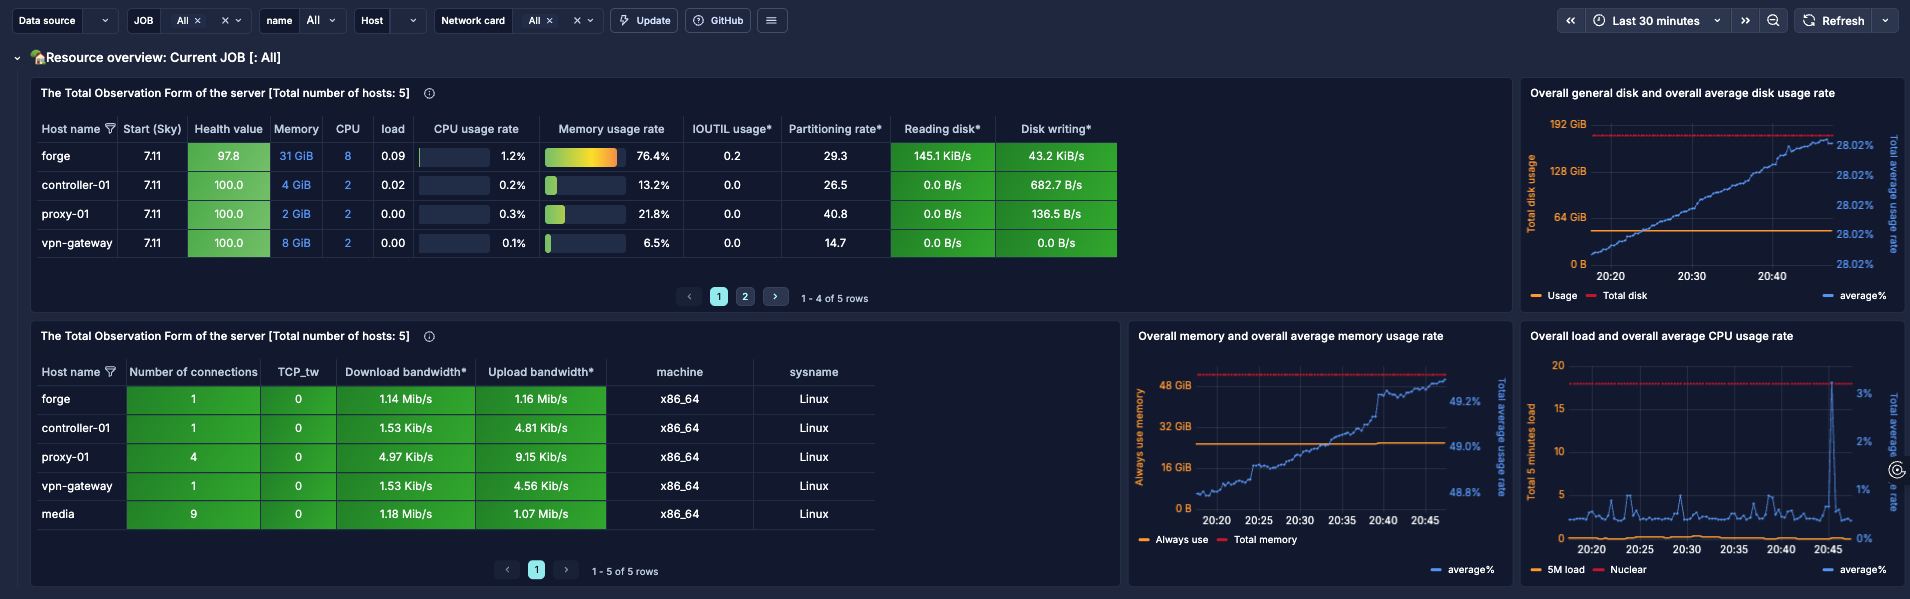
Monitoring Dashboard Preview
Screenshot of the Grafana dashboard used to monitor system health, resource utilization, and infrastructure status across the PatrickHomeLab environment.